Terraforming Grafana and Influx Data Source
I have been using Grafana for a little over a year, but I haven’t had the chance to start using Terraform with it, so I decided to create a blog post to explore its use. After a quick look around the documentation, it currently allows uploading existing dashboards saved as JSON or creating folders, organizations, and data sources. Now it was a little disappointing about the dashboards, yet I can understand why. Being able to create folders, organizations, and data sources are still lovely as it gives a standard way to create data sources, especially when you need to create them consistently across environments, data centers, etc. If you don’t have a Grafana instance or InfluxDB instance that you can use, read the next section that describes how to get both up and running with Docker.
I streamed the creation of this post to YouTube in two sessions, stream 1 and stream 2.
Infrastructure setup
We run a Grafana instance and an Influxdb instance using containers.
Grafana
Let’s start by running the below command to pull and start our Grafana container.
docker run -d -p 3000:3000 --name grafana grafana/grafana
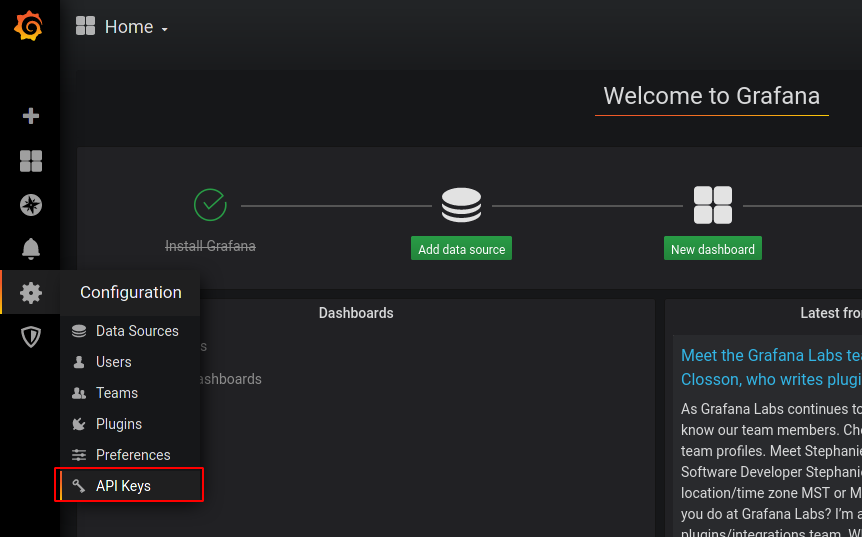
Now we need to navigate to http://localhost:3000 and log in. The default Grafana username and password is admin. Once logged in, we need to navigate to Configuration –> API Keys or click here http://localhost:3000/org/apikeys.
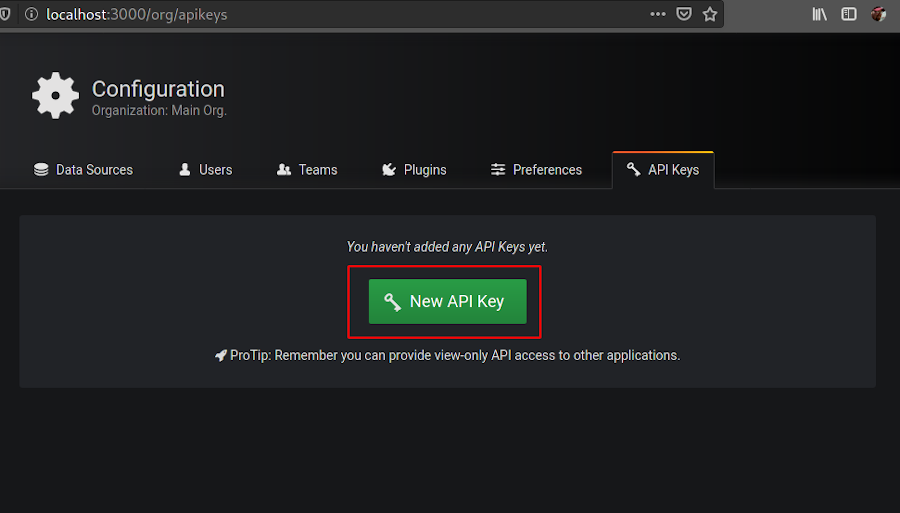
Now let’s create a new key by clicking on the big green button in the center of the screen.
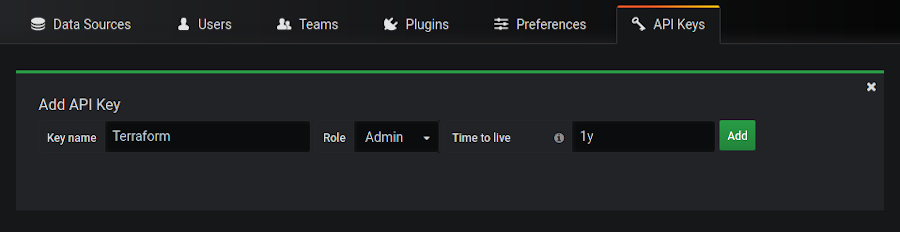
Now we will name our key Terraform, and we will make it an admin and set the expiration to 1y, which is one year.
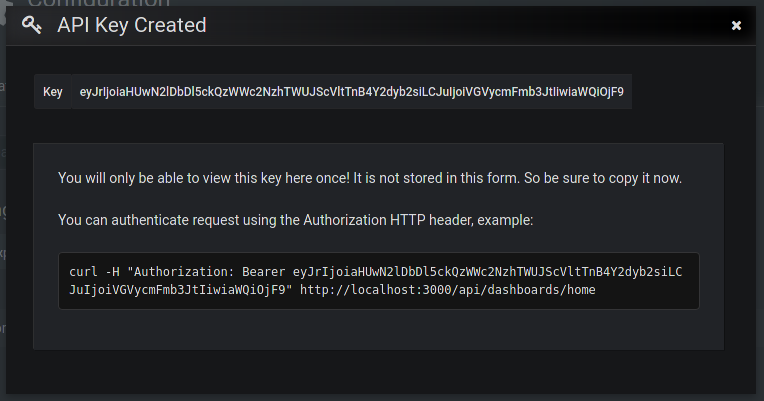
You will get a pop-up with your API Key. Make sure to save that somewhere that you can retrieve it later, if this is an actual system, then keep this in a secure location like a password manager, BitWarden is an open-source one.
InfluxDB
Let’s start by running the below command to pull and start our InfluxDB container.
docker run -d -p 8086:8086 --name influx influxdb/influxdb
Now we need to seed some data in our InfluxDB instance we have running. Execute the following commands using curl to create a database and insert a single record. We will use this to validate our Terraform.
curl -G http://localhost:8086/query --data-urlencode "q=CREATE DATABASE mydb"
curl -i -XPOST 'http://localhost:8086/write?db=mydb' --data-binary 'cpu_load_short,host=server01,region=us-west value=0.64 1434055562000000000'
Terraform Setup
We are now ready to dive into creating our Terraform to wire it all up. Let’s start by creating our main.tf file.
$ touch main.tf
Now let’s add the Grafana Provider to our main.tf. We will need the URL of our Grafana instance and the API key that we created.
provider "grafana" {
  url  = "http://localhost:3000/"
  auth = "eyJrIjoiZlo4djExcWs3VnZ4c28wRHVHTWdsNXNiMVVCMEpNaVgiLCJuIjoiVGVycmFmb3JtIiwiaWQiOjF9"
}
Now let’s initialize our Terraform.
$ terraform init
* provider.grafana: version = "~> 1.5"

Terraform has been successfully initialized!
Now let’s use the folder resource to verify that our Grafana connection is working.
resource "grafana_folder" "test" {
  title = "Test Folder"
}
Let’s create our folder now in Grafana using Terraform.
$ terraform apply
Terraform will perform the following actions:

An execution plan has been generated and is shown below.
Resource actions are indicated with the following symbols:
  + create

  # grafana_folder.test will be created
  + resource "grafana_folder" "test" {
      + id    = (known after apply)
      + title = "Test Folder"
      + uid   = (known after apply)
    }

Plan: 1 to add, 0 to change, 0 to destroy.

Do you want to perform these actions?
  Terraform will perform the actions described above.
  Only 'yes' will be accepted to approve.

  Enter a value: yes

grafana_folder.test: Creating...
grafana_folder.test: Creation complete after 0s [id=1]

Apply complete! Resources: 1 added, 0 changed, 0 destroyed.
Awesome! Our provider can connect. Now log into Grafana and make sure that the folder exists. Now it is time to get to the fun stuff.
InfluxDB data source
Now it’s time to create our InfluxDB data source. If you are running the local container, then the username needs to be set as admin, and the password doesn’t matter in this example, so set it to something random. The access mode for InfluxDB is proxy by default, which means Server(default). We need to use the “Browser” access mode, which is the key direct.
resource "grafana_data_source" "mydb" {
  type          = "influxdb"
  name          = "mydb"
  url           = "http://localhost:8086"
  username      = "admin"
  password      = "foobarbaz"
  access_mode   = "direct"
  database_name = "mydb"
}
Now we can create our data source.
$ terraform apply
grafana_folder.test: Refreshing state... [id=1]

An execution plan has been generated and is shown below.
Resource actions are indicated with the following symbols:
  + create

Terraform will perform the following actions:

  # grafana_data_source.mydb will be created
  + resource "grafana_data_source" "mydb" {
      + access_mode        = "direct"
      + basic_auth_enabled = false
      + database_name      = "mydb"
      + id                 = (known after apply)
      + is_default         = false
      + name               = "mydb"
      + password           = (sensitive value)
      + type               = "influxdb"
      + url                = "http://localhost:8086"
      + username           = "admin"
    }

Plan: 1 to add, 0 to change, 0 to destroy.

Do you want to perform these actions?
  Terraform will perform the actions described above.
  Only 'yes' will be accepted to approve.

  Enter a value: yes

grafana_data_source.mydb: Creating...
grafana_data_source.mydb: Creation complete after 0s [id=1]

Apply complete! Resources: 1 added, 0 changed, 0 destroyed.
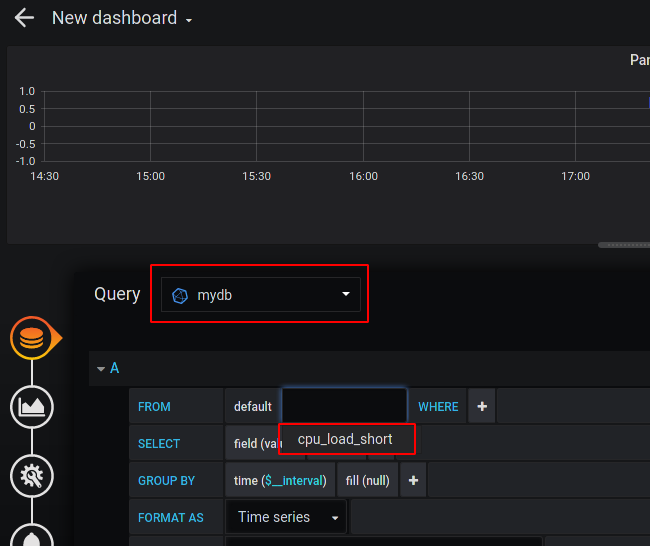
Now you can log into Grafana, and you should see the data source. Try creating a Grafana dashboard with the data source and see if the data gets pulled back. Your dashboard should look like this:
Below is the complete Terraform.
provider "grafana" {
  url  = "http://localhost:3000/"
  auth = "eyJrIjoiZlo4djExcWs3VnZ4c28wRHVHTWdsNXNiMVVCMEpNaVgiLCJuIjoiVGVycmFmb3JtIiwiaWQiOjF9"
}

resource "grafana_folder" "test" {
  title = "Test Folder"
}

resource "grafana_data_source" "mydb" {
  type          = "influxdb"
  name          = "mydb"
  url           = "http://localhost:8086"
  username      = "admin"
  password      = random_password.password.result
  access_mode   = "direct"
  database_name = "mydb"
}
Conclusion
Thanks for reading this quick walkthrough on how to connect Terraform to Grafana and create a few items. You can use this to grow your implementation. If you have any questions, please reach out to me on social media, GitHub, or YouTube, and I will try to answer them.
If you enjoy the content, then consider buying me a coffee.