Creating Maps with Dash
I originally got into software development through GIS and Geology, with my first job doing development was on a GIS development team. After leaving GIS back in 2014, I haven’t used much of that knowledge. Learning Dash got me thinking if I could make a map with it, and of course, you can. I grabbed some USGS data on Geothermal systems, which is available as a shapefile. I then used QGIS to export the data out as a CSV file. All the code and the data can be found in this GitHub repo.
Installing Python Pacages
We will be using Dash and pandas to create our map, so we need to install those.
$ pip install pandas dash
Successfully installed Flask-1.1.2 Jinja2-2.11.2 MarkupSafe-1.1.1 Werkzeug-1.0.1
brotli-1.0.9 click-7.1.2 dash-1.17.0 dash-core-components-1.13.0
dash-html-components-1.1.1 dash-renderer-1.8.3 dash-table-4.11.0
flask-compress-1.8.0 future-0.18.2 itsdangerous-1.1.0 numpy-1.19.4
pandas-1.1.4 plotly-4.12.0 python-dateutil-2.8.1 pytz-2020.4 retrying-1.3.3
six-1.15.0
Creating our Dash application
Create a file called app.py and add the code that is below. This is very similar to the introductory tutorial for Dash, with a few exceptions. We do not use Plotly Express, instead if we import the Ploty graph_objects.
# -*- coding: utf-8 -*-

# Run this app with `python app.py` and
# visit http://127.0.0.1:8050/ in your web browser.

import dash
import dash_core_components as dcc
import dash_html_components as html
import plotly.graph_objects as go
import pandas as pd

app = dash.Dash(__name__)
We then leverage pandas to read in our CSV file. We then add a field to our pandas dataframe that combines the name and state as text.
df = pd.read_csv('Geothermals.csv')
df['text'] = df['Name'] + ', ' + df['State']
We then create our map by configuring our longitude and latitude fields. We set the text to our calculated field, and we will use the most likely temperature in celsius of the geothermal reservoir, which is the Temp_C_ML field from the CSV. Finally, we update the figure’s layout to scope it to the USA. If we don’t, then the map would show the entire world.
fig = go.Figure(data=go.Scattergeo(
    lon=df['Lon_84'],
    lat=df['Lat_84'],
    text=df['text'],
    mode='markers',
    marker_color=df['Temp_C_ML']
))

fig.update_layout(
    geo_scope='usa'
)
Now we have our map created, we just need to do the usual Dash layout, wire our figure up as a graph, and make our app.py executable.
app.layout = html.Div(children=[
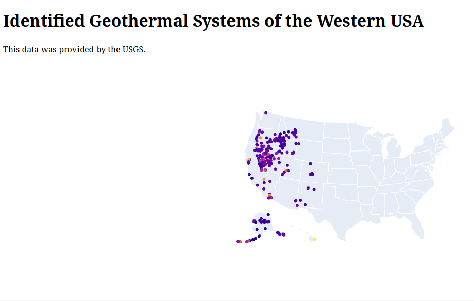
html.H1(children='Identified Geothermal Systems of the Western USA'),
html.Div(children='''
This data was provided by the USGS.
'''),
dcc.Graph(
id='example-map',
figure=fig
)
])
if __name__ == '__main__':
app.run_server(debug=True)
Running our Dash Maps
At this point, we can execute our Dash application and see our map in the browser.
$ python app.py
Dash is running on http://127.0.0.1:8050/

 * Serving Flask app "app" (lazy loading)
 * Environment: production
   WARNING: This is a development server. Do not use it in a production
            deployment.
   Use a production WSGI server instead.
 * Debug mode: on
If we navigate to http://127.0.0.1:8050 we should see the following.
Conclusion
I found this fun, and it used some skills that I haven’t used in years. I have a few other tutorials around Dash that I encourage you to check out.
Thanks for reading,
Jamie
If you enjoy the content, then consider buying me a coffee.